Insight & Reporting
See how your practice is doing, from today’s to-do list to the year’s numbers, and ask for whatever’s missing.

The dashboard
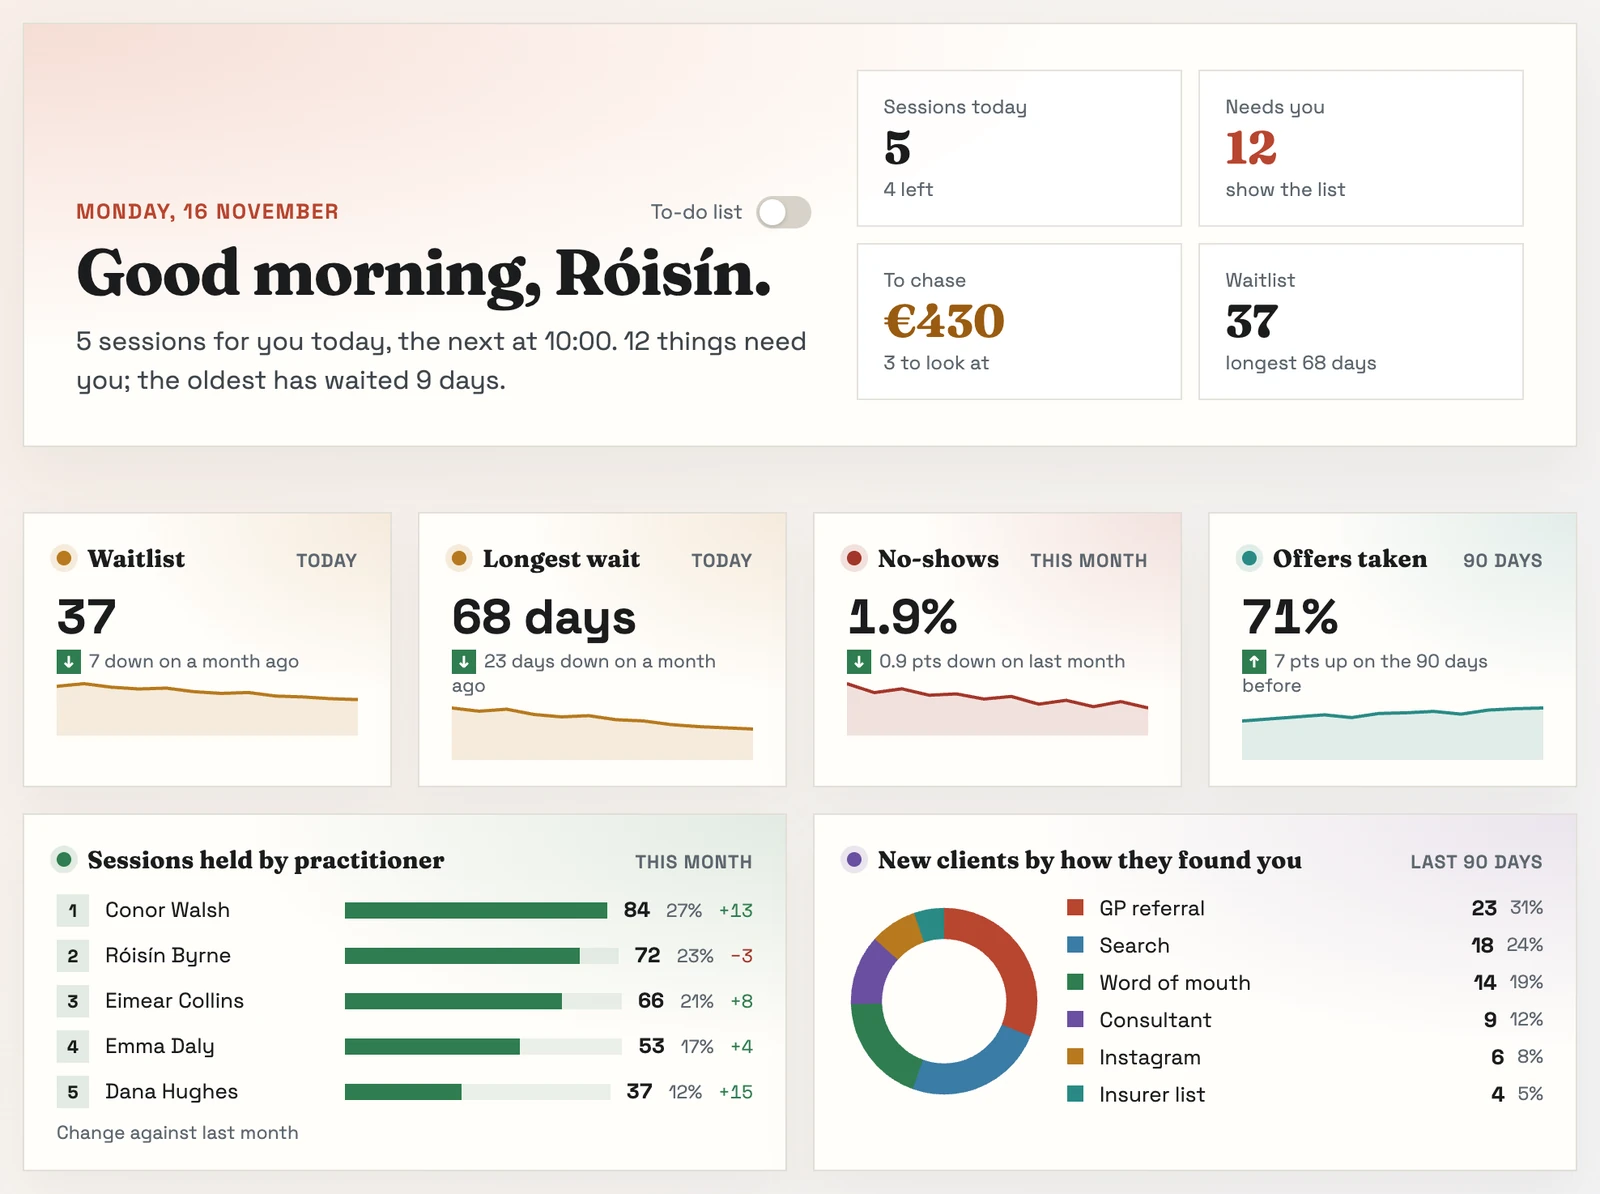
Your practice, at a glance.
Open Pracler and it tells you how the day looks and what’s waiting on you.
- Your day, your to-do list and the practice’s numbers on one screen
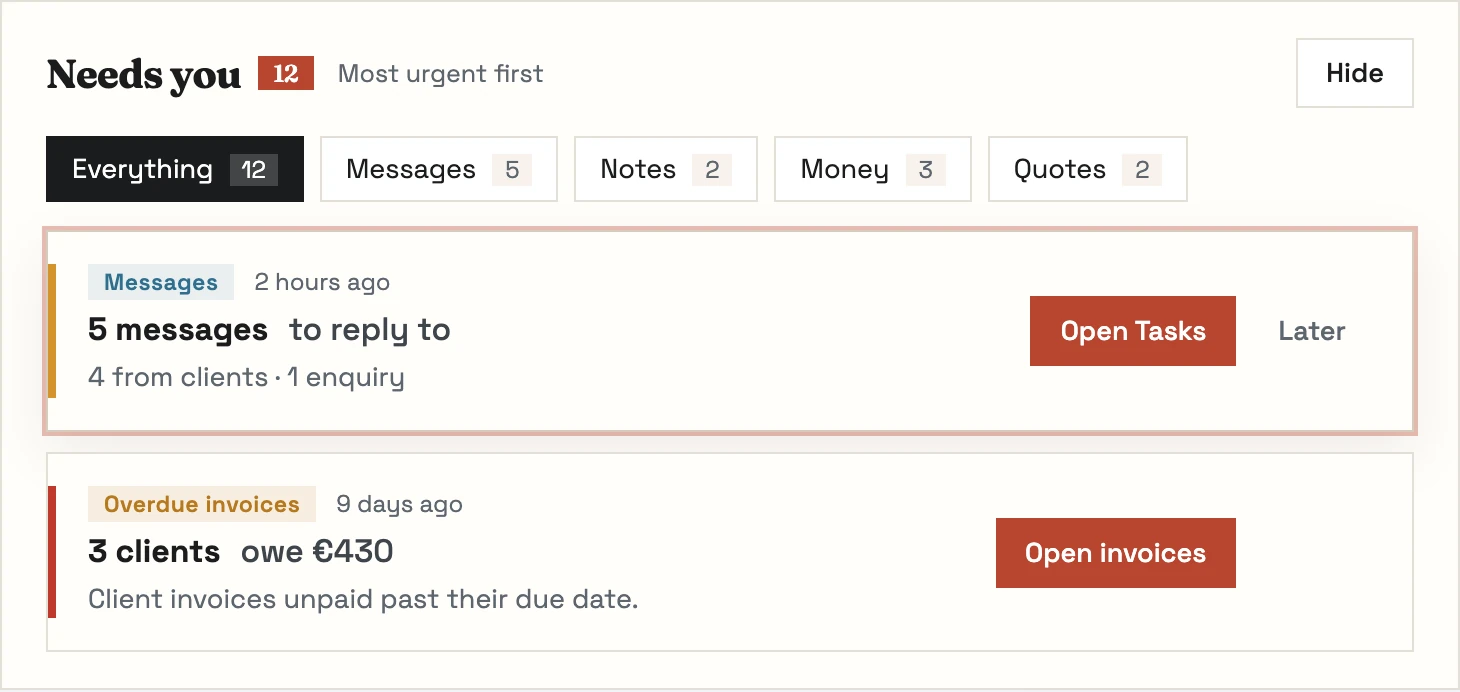
- One to-do list, most urgent first
- A dashboard for each person, on the computer or the phone
- Practitioners see their own numbers. The money stays with the owner
Just ask
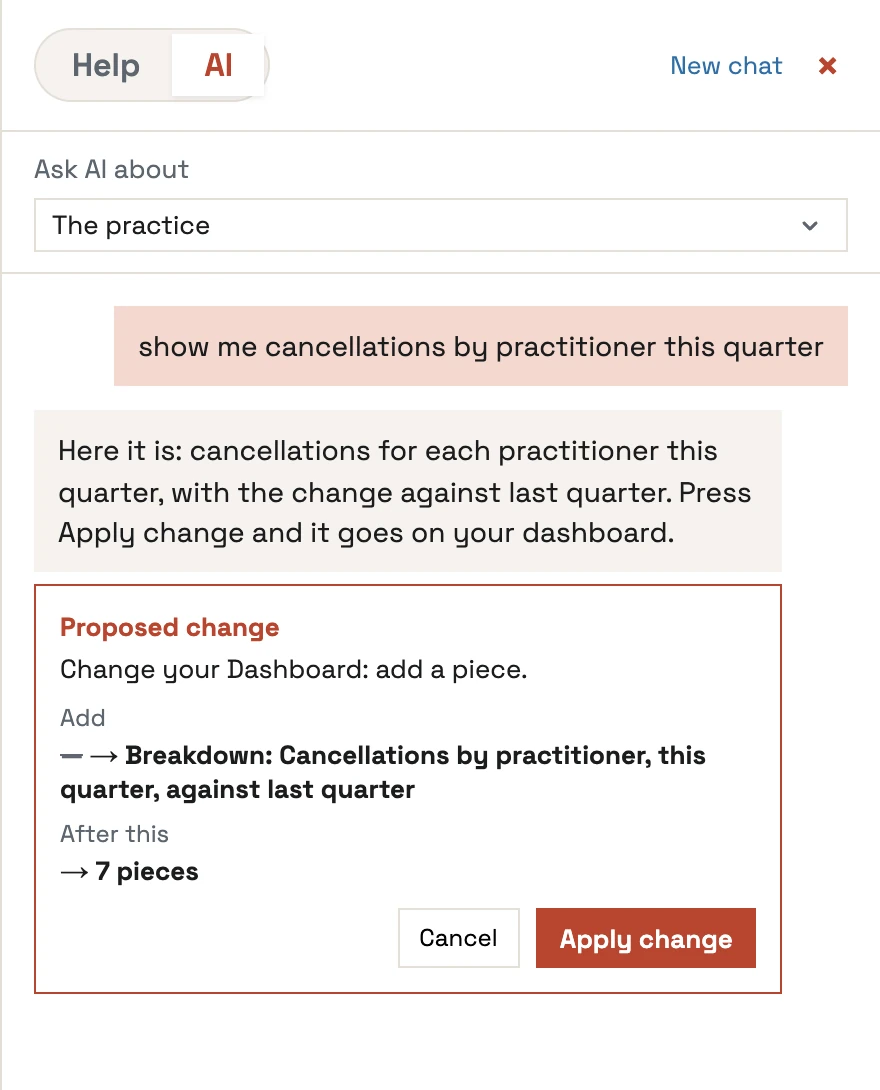
Add any chart by asking for it.
Ask in plain English, check the preview and press Apply.
- More than 90 measures and 21 ways to show them
- Split by practitioner, clinic or appointment type, over any period
- Change your mind and undo it. Owners set the layout everyone starts with
- The AI works from the names of the measures, never your figures
Diaries
See how full each diary is.
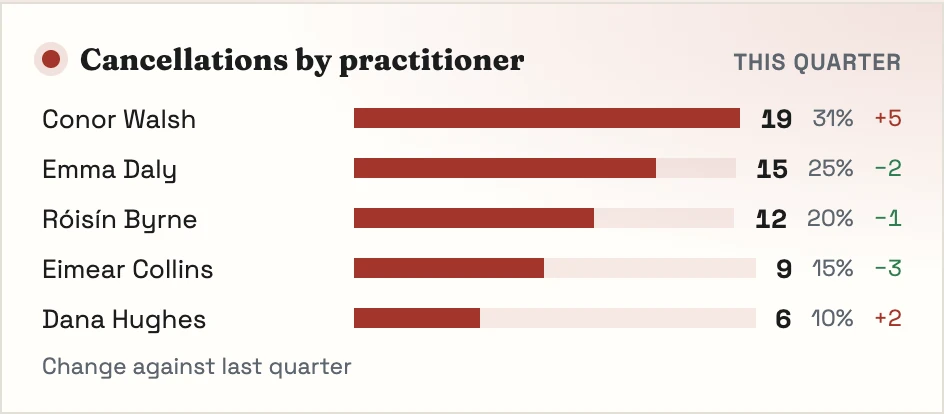
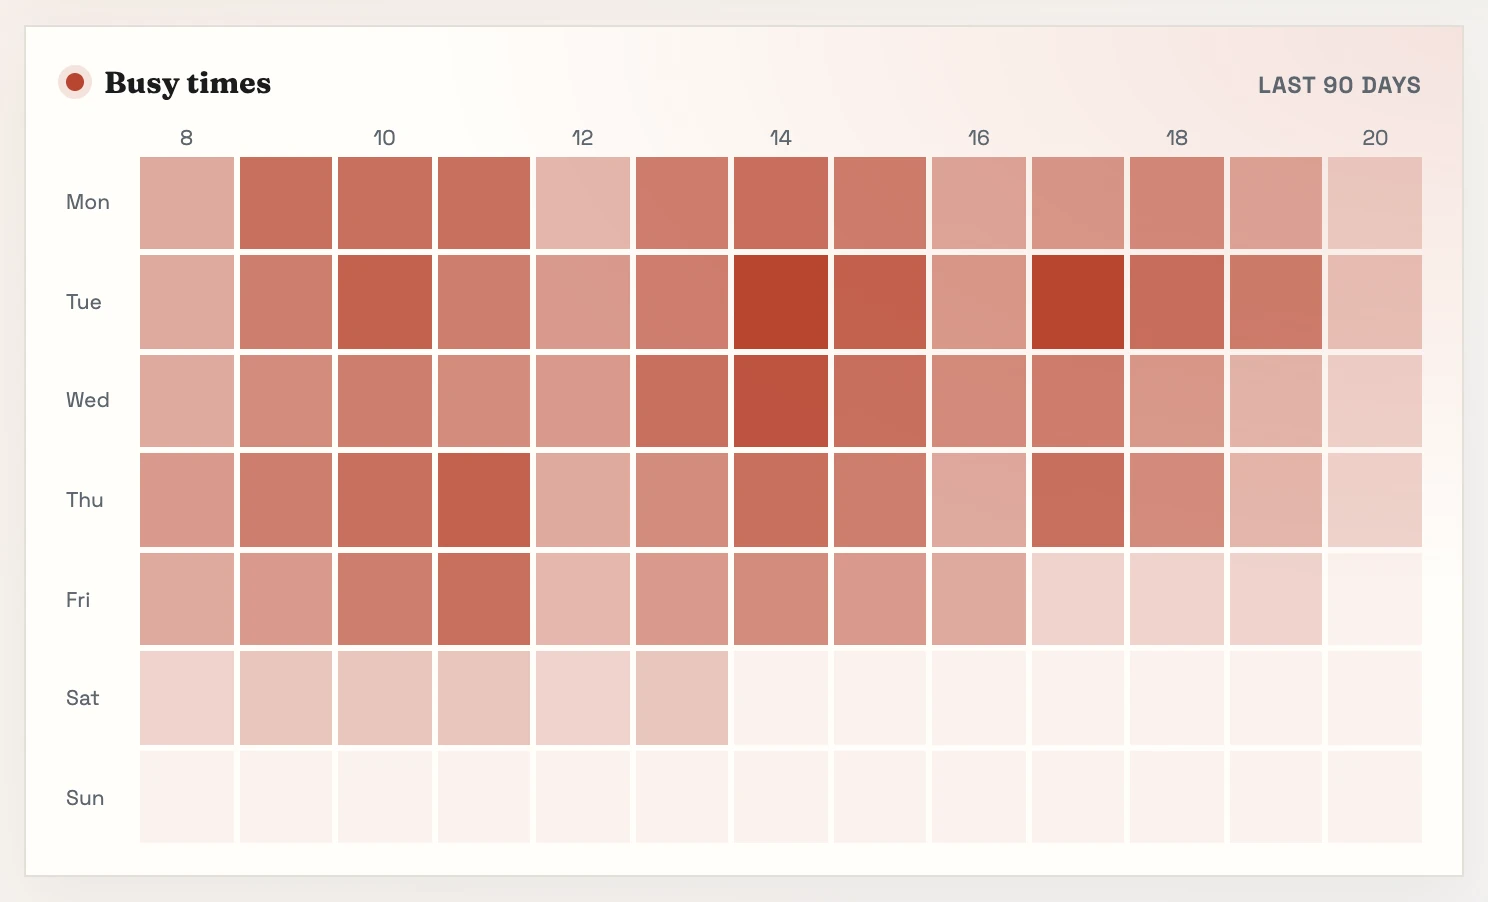
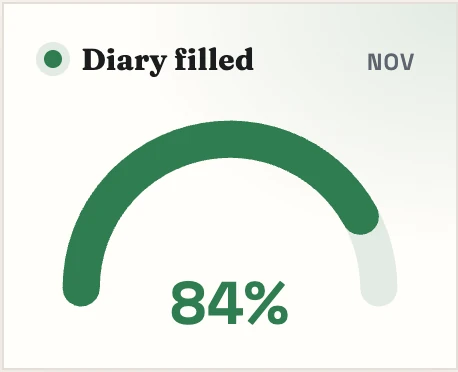
Hours booked against hours offered, your busiest times, and what gets cancelled.
- For each practitioner, room and location
- Busy times by day and hour, so you know when to add a clinic
- Any week beside the same week last year
Outcomes
Show that your clients are getting better.
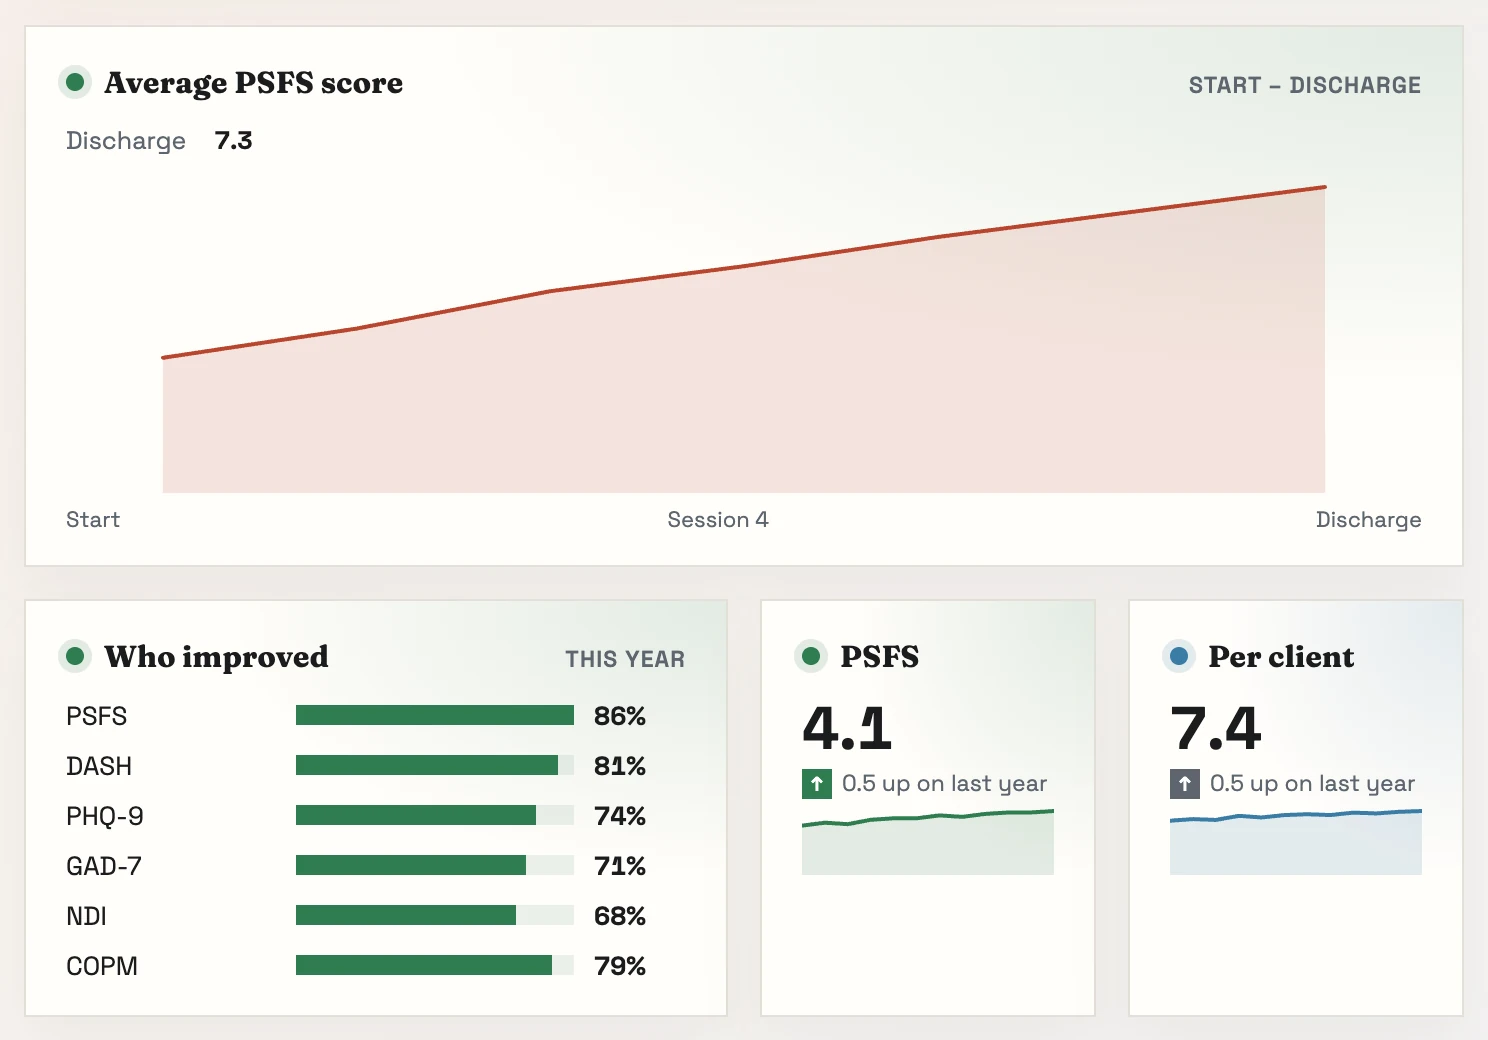
Outcome measures, goals and feedback, added up across the whole caseload.
- Average change in PSFS, PHQ-9, GAD-7 and the rest, from first session to discharge
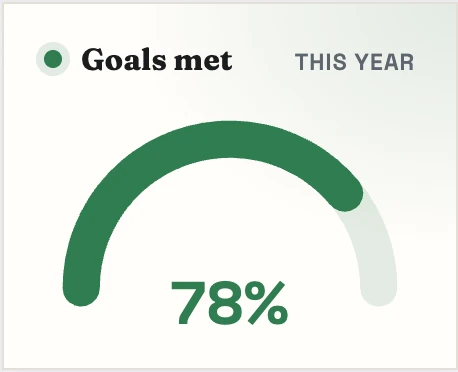
- Goals met at discharge, by practitioner or by condition
- Figures you can hand to a referrer or an insurer
Reports
Reports emailed on a schedule.
Pick the pieces you want and how often. Pracler sends the report, or you export it.
- Weekly, monthly or at quarter end, to you or your accountant
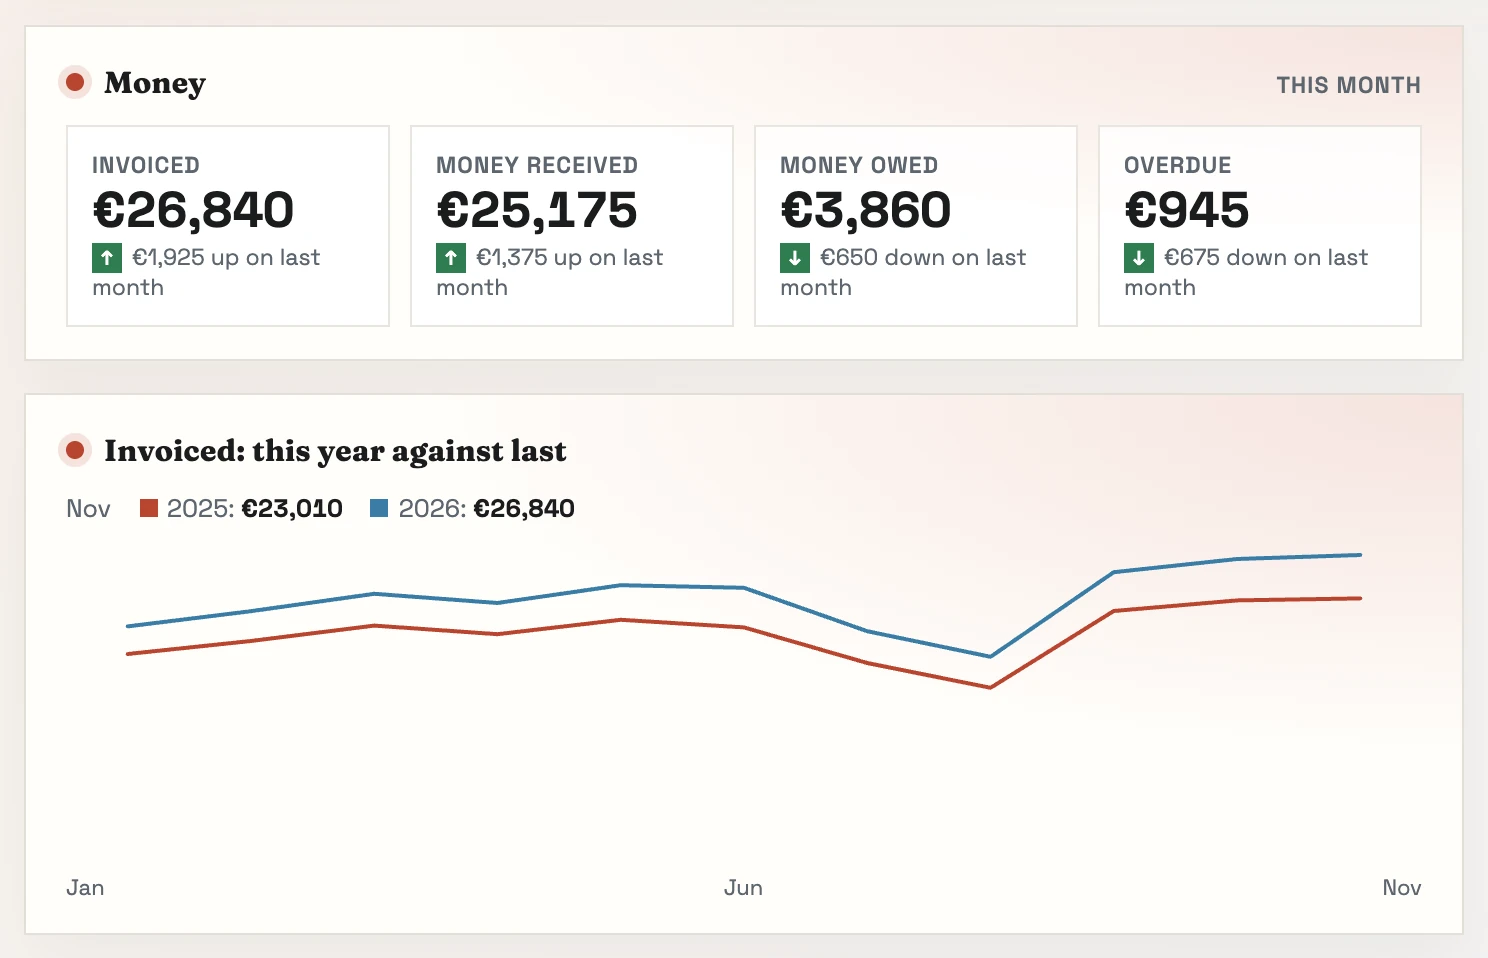
- Income, money owed and profit, this year against last
- Practitioners never see a money figure
More in insight & reporting
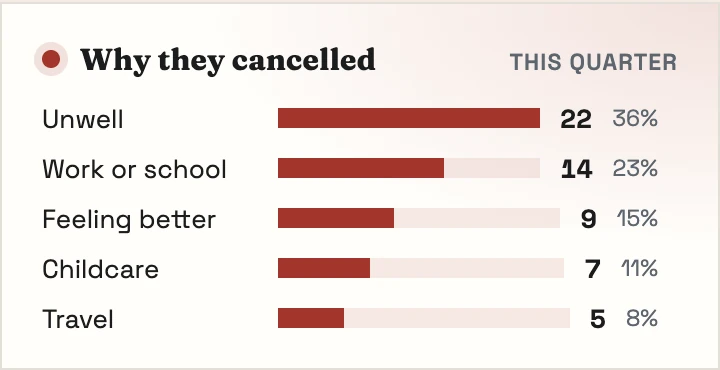
Cancellations and no-shows
Who cancelled and why, with late cancellations counted on their own.
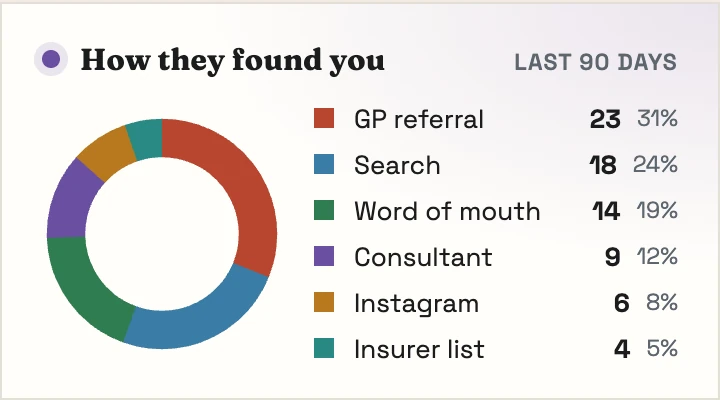
Where new clients come from
GP, search, word of mouth or Instagram, and which referrers send the most.
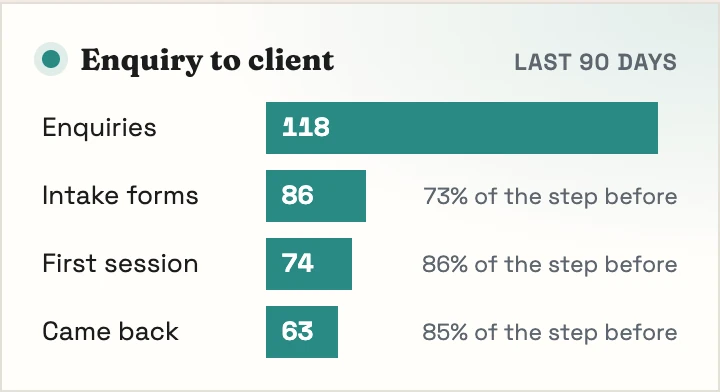
Enquiry to first session
How many enquiries become clients, and where the rest drop off.
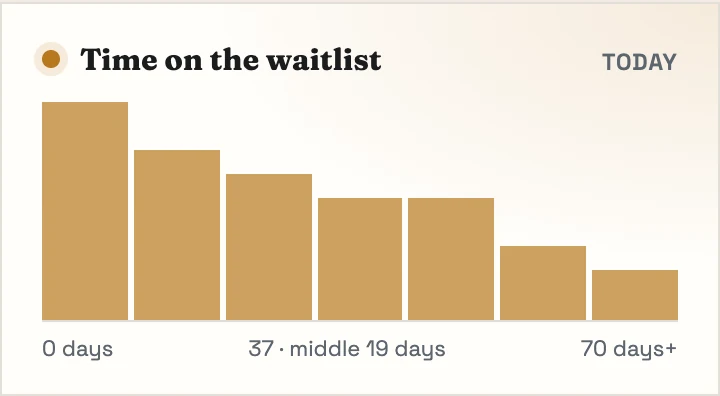
Waitlist and wait times
How many are waiting, the longest wait and the average, for each clinic.
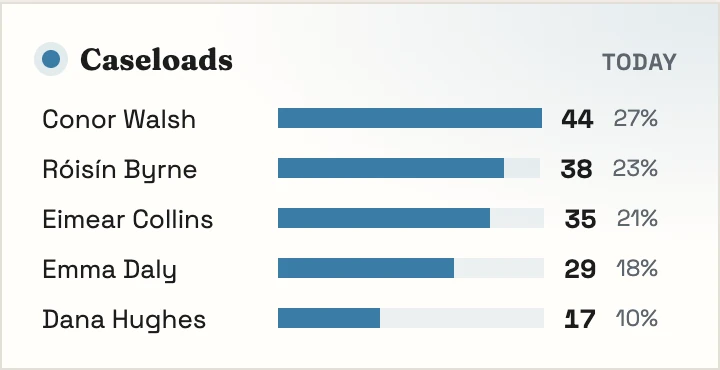
Caseload per practitioner
See who has room and who’s full before you take on the next client.
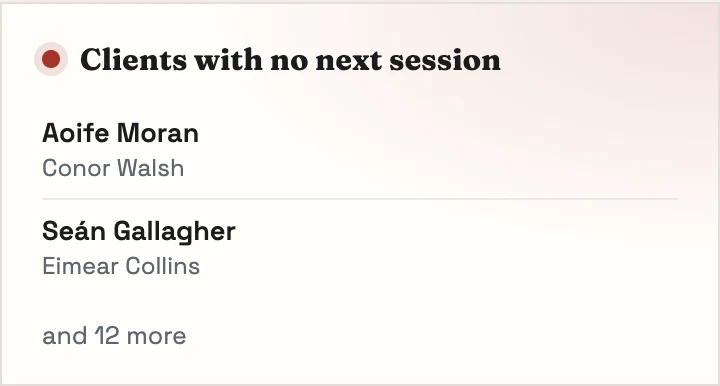
Clients with no next session
Everyone who’s been seen and hasn’t rebooked, one click from the booking window.
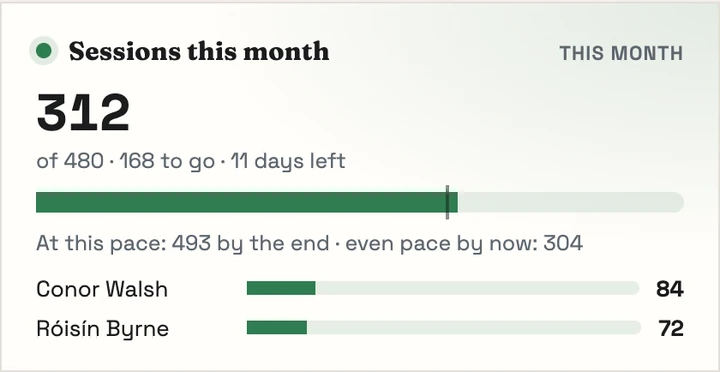
Practitioner targets
Set sessions or hours for the month and see who’s on pace.
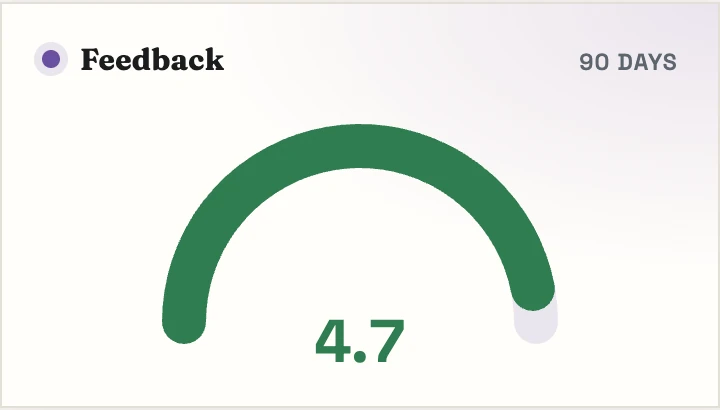
Client feedback
Scores after the first and fifth session, with a private line to the owner.
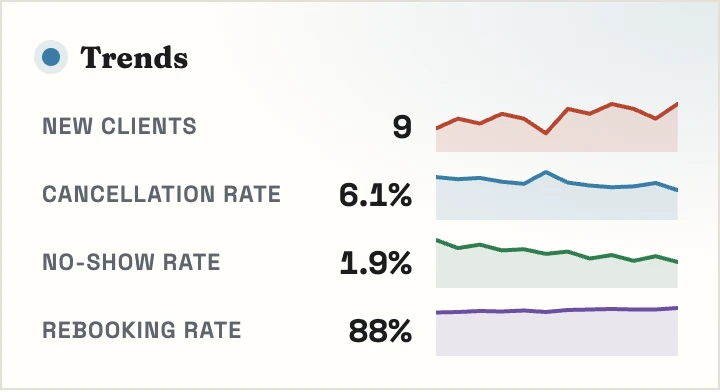
Rebooking and retention
How many clients rebook and how many sessions they stay for, week by week.
Class and group attendance
How full each class runs, who came and who’s waiting for a place.
Before and after a change
Mark the day you changed a price or a rule and see what moved.
Request a report we don’t have
Your request goes to our team. If we build it, every practice gets it.
What one practice asks for, every practice can switch on. How requests become features
Early access · 30-day free trial
See your own practice’s numbers.
We set up each early-access practice in person and move your data across, so the dashboard starts with your own clients and sessions.